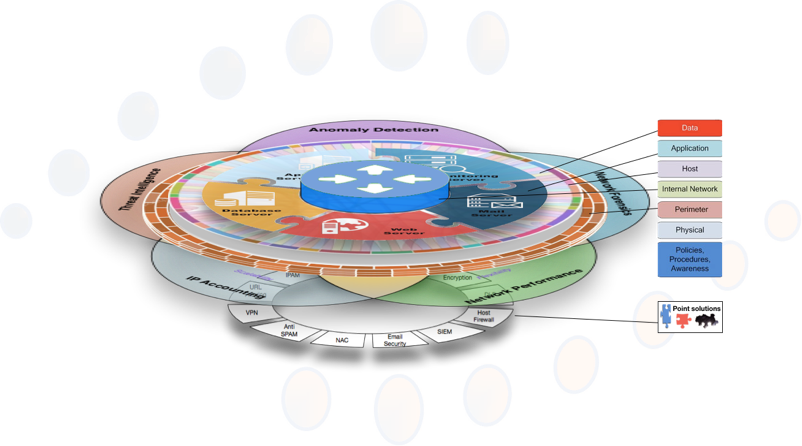
Security-grade performance analytics with full-fidelity flow visibility
CySight qualifies data movement across network, cloud, host, and application layers, then ties what changed to segmentation context and forensic evidence. This turns performance analytics into measurable security, compliance, and audit outcomes.
Turn visibility into outcomes
CySight is built for environments where encryption, segmentation, scale, and operational variance make traditional tooling unreliable. It restores the ability to see, trace, and prove what is happening across the enterprise, using evidence you can stand behind.
Security outcomes
Reduce dwell time by moving from anomaly to root cause in seconds with evidence-grade pivots.
Compliance outcomes
Defensible audit trails tied to assets, accounts, services, and segmentation boundaries.
Operational outcomes
Performance analytics that explains change, attribution, and blast radius without losing granularity at scale.
Lower alert fatigue
Prioritize what matters with baselining and repeat-pattern scoring rather than noisy threshold lists.
What Performance Analytics means in CySight
Performance is not separate from security. It is the same telemetry, the same movement, and the same accountability. CySight treats performance analytics as a security observability workflow, so every finding can be validated, reproduced, and exported.
AI dashboard with unified context
Threats, anomalies, spikes, reconnaissance, infiltration, exfiltration, endpoint signals and suspicious lateral movement in one operational view with fast pivots across evidence.
Event and AI anomaly analysis
Deviation scoring against continuously learned baselines for each asset and service footprint across time windows, with optional vector store and SLM support to speed correlation and generate evidence-grounded explanations.
Multiview analytics
Correlate traffic across organizational units to validate segmentation, detect lateral movement, and prove scope.
Forensic traffic accounting
Reconstruct conversations with contextual evidence tied to applications, ports, protocols, and ownership.
Scheduler and reporting
Turn any analysis into a scheduled report or alert, and export for SOC, compliance, and business workflows.
Flow and vendor breadth
Supports routers, switches, firewalls, WiFi, SDN, cloud, Kubernetes, Kafka, NetFlow, IPFIX, sFlow, and enriched sources.
Granularity retention strategy
Keep high-fidelity detail where it matters and preserve system resilience during record explosions and outbreaks.
Designed to scale without probes
Agentless architecture built to retain evidence and visibility without probe-per-segment sprawl.
Open workflow - from health to proof
Investigations should not force a fixed sequence. CySight keeps scope across pivots so teams can move from symptom to root cause to evidence without rework.
AI dashboard interaction Situational awareness
Menus and workflow views Fast pivots
AI baselining Detect deviation
Comparative windows Explain change
Deployment freedom Connected or air-gapped
Zero Trust ownership mapping Macro and micro segmentation
Forensic readiness Evidence-grade detail
Scheduler and exports Operationalize
Deep dive - Performance Analytics feature set
Monitoring without probes Flow, cloud logs, enriched metadata
- Supports NetFlow, IPFIX, sFlow and variants, plus cloud logs such as AWS, Azure, and GCP.
- Uses device and vendor metadata where available without requiring intrusive probes.
- Enables utilization reporting across devices, interfaces, IPs, protocols, ports, QoS, and more.
Baselining Short term and long term comparative analysis
- Compare minute vs recent minutes, hour vs recent hours, weekday vs historical weekdays, month vs historical months.
- Identify which element caused the change and when by comparing across the timeline.
Powerful and flexible analysis Any combination of fields
- Analyze across usage, packets, flows, utilization, QoS, applications, and more.
- Deviation and count-style analytics to surface excessive flows, unusual change, or emerging flood patterns.
- Bi-directional and cross-section perspectives to pinpoint responsibility and scope.
Anomaly detection, alerting, reporting Unattended workflows
- Create anomaly baselines and thresholds tuned to reduce false positives.
- Automate scheduled reports to email, file targets, portals, or downstream systems.
- Export in HTML, CSV, JSON, or PDF for operations and compliance.
Data collection tuning Granularity where it matters
- Collect per-minute granularity where forensics is required and per-hour where trending is sufficient.
- Self-maintaining rules protect the system during outbreaks that cause record explosion.
Scalability and resilience Fault tolerance and self-healing
- Modular collection and analysis separation across segmented networks and environments.
- Health monitoring across processes supports resilient operation and recovery.

